
A new survey of American adults finds that 55% oppose and 44% support “allowing autonomous vehicles (AVs), also called ‘driverless cars,’ to offer rides in your state.” The strength of opposition is stronger than the strength of support. Twenty-five percent strongly oppose robotaxis, while 8% strongly support them.
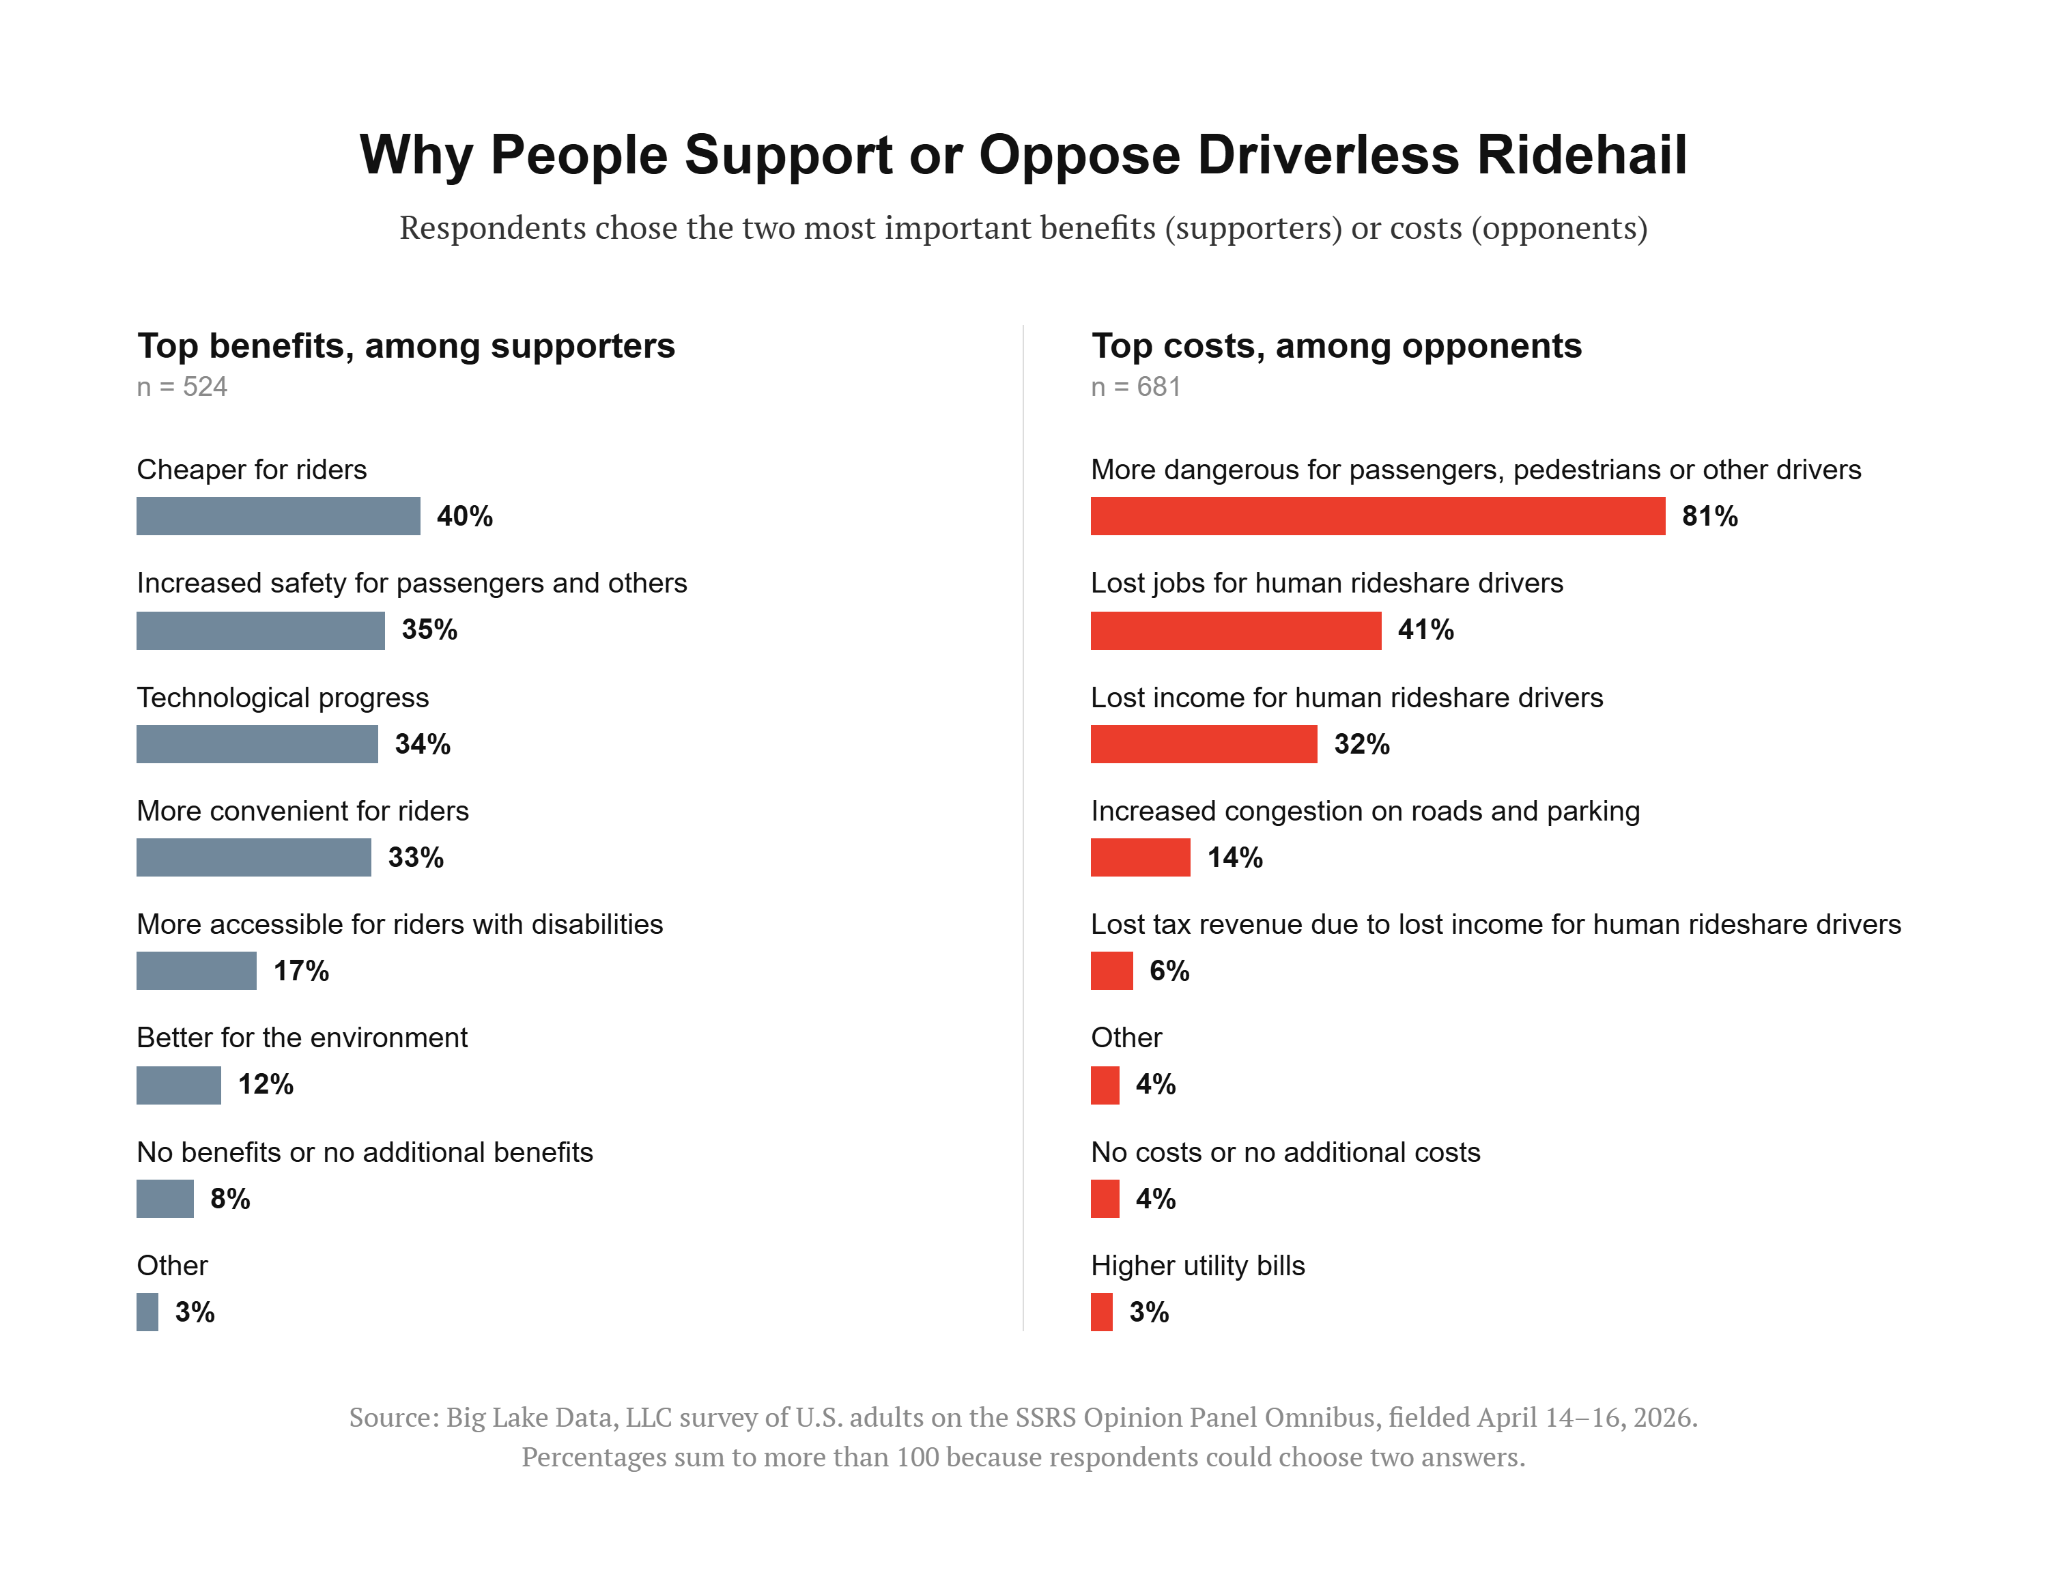
Respondents who oppose robotaxis were shown a list of costs and invited to select the two most important. The most important cost is danger to “passengers, pedestrians, or other drivers.” This was chosen by 81% of respondents. Employment related concerns are the second and third most cited costs: forty-one percent choose lost jobs for ridehail drivers, and 32% choose lost income for ridehail drivers. Other options are far less popular. Fourteen percent cite increased congestion, 6% lost tax revenue, 4% unspecified other costs, and 3% higher utility bills.
Respondents who support robotaxis were likewise shown a list of benefits and asked which two were most important. The most popular reason is “cheaper for riders” at 40%, followed by increased safety at 35%, technological progress at 34%, and more convenience at 33%. Fewer respondents choose accessibility for riders with disabilities (17%) or environmental benefits (12%).
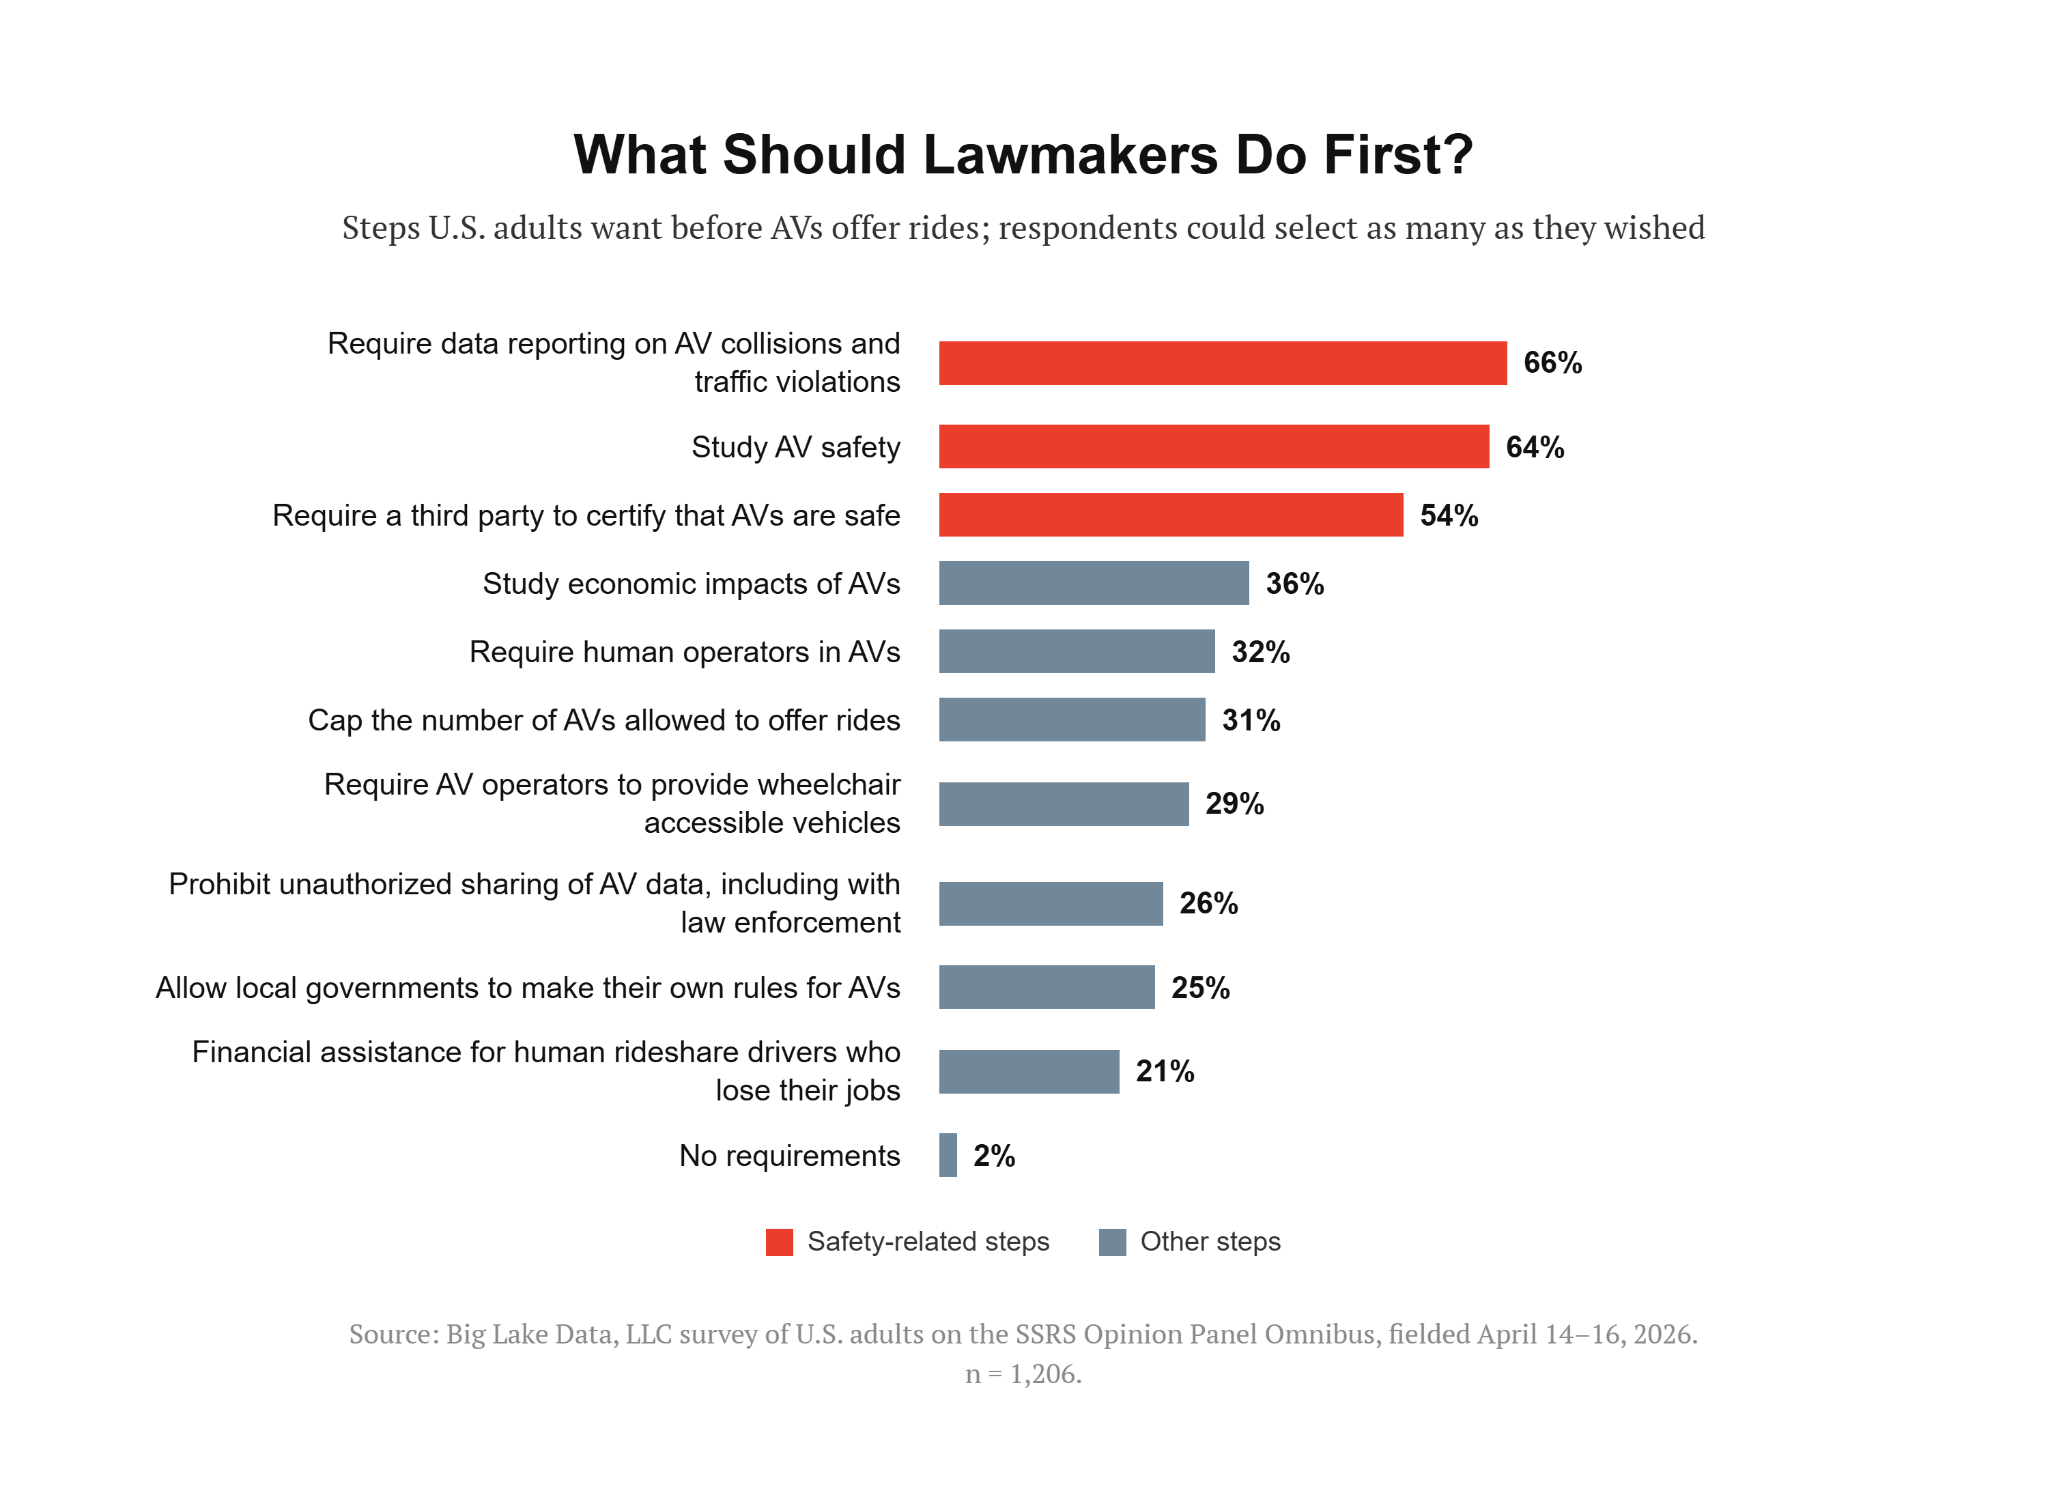
All respondents were shown a list of policies and asked “What steps should lawmakers take before allowing autonomous vehicles (AVs) (also called ‘driverless cars’) to offer rides?” Respondents could select as many as they wished.
The top three proposed policies all deal with safety. Sixty-six percent support mandatory data reporting on AV collisions and traffic violations, 64% support more study of AV safety, and 54% support requiring third-party safety certification.
Studying the economic impacts of robotaxis is the choice of 36%. Thirty-two percent would require human operators in robotaxis, and 31% would cap the number of robotaxis allowed to offer rides.
Twenty-nine percent would require robotaxi operators to provide wheelchair accessible vehicles. Twenty-six percent would prohibit “unauthorized sharing of AV data, including with law enforcement,” and 25% support allowing local governments to make their own rules for AVs. Financial assistance for human ridehail drivers who lose their jobs draws support from 21% of respondents.
Only 2% of respondents recommend “no requirements” before allowing robotaxis.
The survey included an oversample of Illinois respondents, with a margin of error of 8.5 Sixty-two percent of Illinois respondents oppose robotaxis, versus 55% of those residing in other states. In general, opposition is highest in northeastern states where 34% support robotaxis and 66% oppose them. Conversely, support is highest in western states, where robotaxis are supported by 52% and opposed by 48%.
Support for robotaxis is highest among those who live in the most urban places and lowest among residents of more rural areas. Fifty-three percent of central city residents support robotaxis while 64% of respondents from suburban and non-metro counties oppose robotaxis.
Uber and Lyft were both founded in the early 2010s and expanded service gradually across the country. In this survey, 43% of adults still report never having used a ridehail app for personal transportation. Another 39% said they do so once a month or less. Thirteen percent use ridehail apps a few times a month. Three percent use them several times a week and 2% nearly every day.
Support for robotaxis is highest among those who use ridehail most frequently. Among those who currently use a ridehail more than once a month, 58% support robotaxis. Support drops to 51% among less frequent riders and 33% among those who have never used a ridehail app.
While the survey finds some variation in support for robotaxis by region, urban-rural mix, and frequency of ridehail app use, there are no meaningful differences by party identification or ideology. Robotaxis are opposed by modest majorities of every partisan group: 54% of Republicans, 56% of independents, and 56% of Democrats. Likewise, opposition is 57% among self-described conservatives, 54% among moderates, and 56% among liberals.
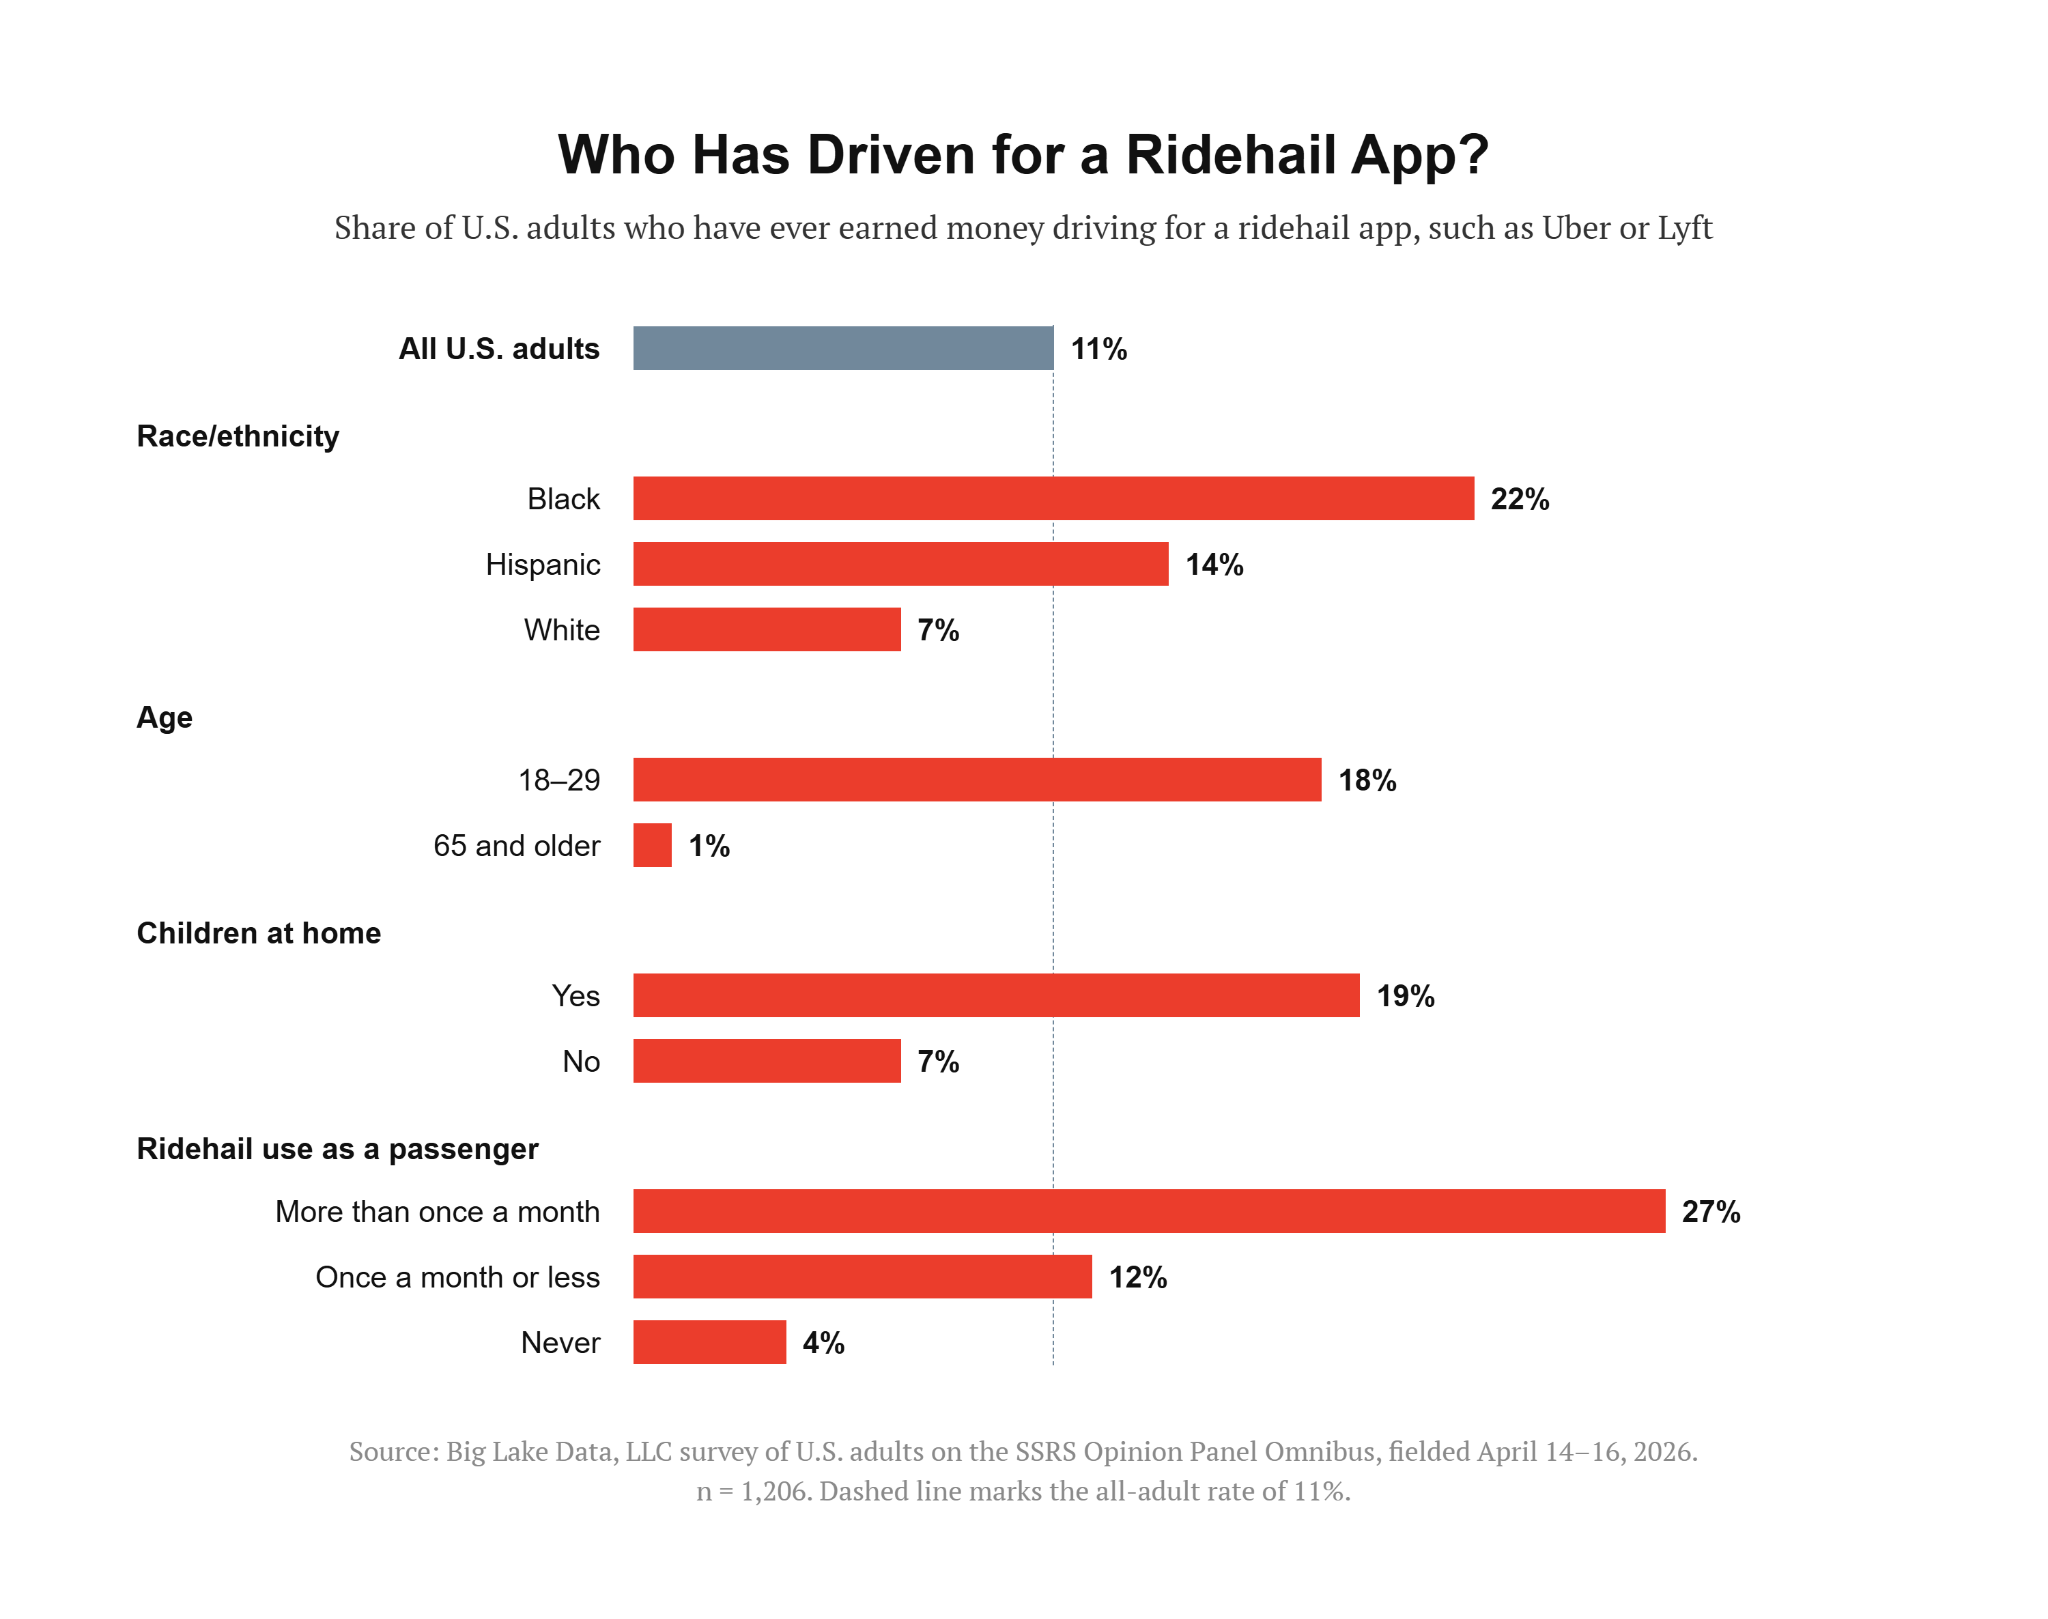
Among all adults, 11% report having ever “earned money by driving for a ridehail app (such as Uber or Lyft).” Five percent have done so within the previous 6 months, while 6% have only done so longer ago. The small size of the driver subsample in this survey limits the conclusions which can be drawn about driver demographics. Nonetheless, large differences are apparent by age, parent status, and frequency of ridehail use as a passenger.
Eighteen percent of those ages 18-29 report having ever driven for a ridehail app, falling to 1% with those ages 65 and older. Nineteen percent of those living with a kid at home have driven for a ridehail app, compared to 7% of those with no child living at home. Those who often make use of ridehail apps as passengers are also much more likely to drive for them. Twenty-seven percent of frequent (more than monthly) ridehail passengers have worked as a ridehail driver at some point, compared with 12% of infrequent riders and 4% of those who say they’ve never used one.
Methodology:
The survey was conducted by Big Lake Data and sponsored by SEIU. It was fielded from April 14-16, 2026 among a general population sample of 1,031 adult respondents, plus an oversample of 175 Illinois residents, using the SSRS Opinion Panel. The margin of error for the full sample is 3.4. For the Illinois subsample, the margin of error is 8.5. Complete topline and crosstab tables for the full set questions are available at here:
Toplines (https://pub.biglakedata.com/polling/April_2026/Toplines.html)
Crosstabs (https://pub.biglakedata.com/polling/April_2026/Crosstabs.html)
For simplicity, this memo uses the term “robotaxis” to describe autonomous vehicles that provide ridehail services to the general public. The survey instrument uses the phrases “autonomous vehicles (AVs)” and “driverless cars.”